Chapter 4 Results
4.1 Descriptives
4.1.1 Covariates: SES, BMIZ at Age 13, ED Cognitions at age 14
Descriptive information for continuous variables are provided in Supplemental Table 8.1. Descriptives for ordinal variables (Parent SES and Fear of Weight Gain) are provided in Supplemental Tables 8.2 and 8.3
4.1.2 Exercise for Weight Loss Frequency
Exercise for weight loss frequency across age and gender is presented in Figure 7.3, with a plot of the raw frequencies at age 24 presented in Supplement (Figure 7.1). Visual inspection of plots suggests a potential increase in frequency of exercise for weight loss across age, with a consistent increase over time amongst girls and an increase in frequency particularly between ages 18 and 24 years amongst boys.
4.1.3 Exercise Issues Frequency
With regards to exercise issues across time, the percentage of participants reporting any exercise issues as present at each age was relatively stable, as seen in Figure 7.4. Although there was some variation in reporting of the secondary question regarding exercise issues across age which could influence the detection of exercise issues at different ages, the question of whether exercise interfered with work, school, or one’s daily routine was assessed at all four timepoints. Endorsement of this question, specifically, was relatively consistent across age and gender (See Supplemental Figure 7.2), with 9.5 - 14.5% of individuals reporting that exercise interfered with work, school, or their daily routine across age and gender.
4.1.4 Exercise Groups
Figure 4.1 shows exercise status at ages 14-24 years in girls and boys, as a percentage of the total number of boys and girls who reported exercise data at the timepoint.
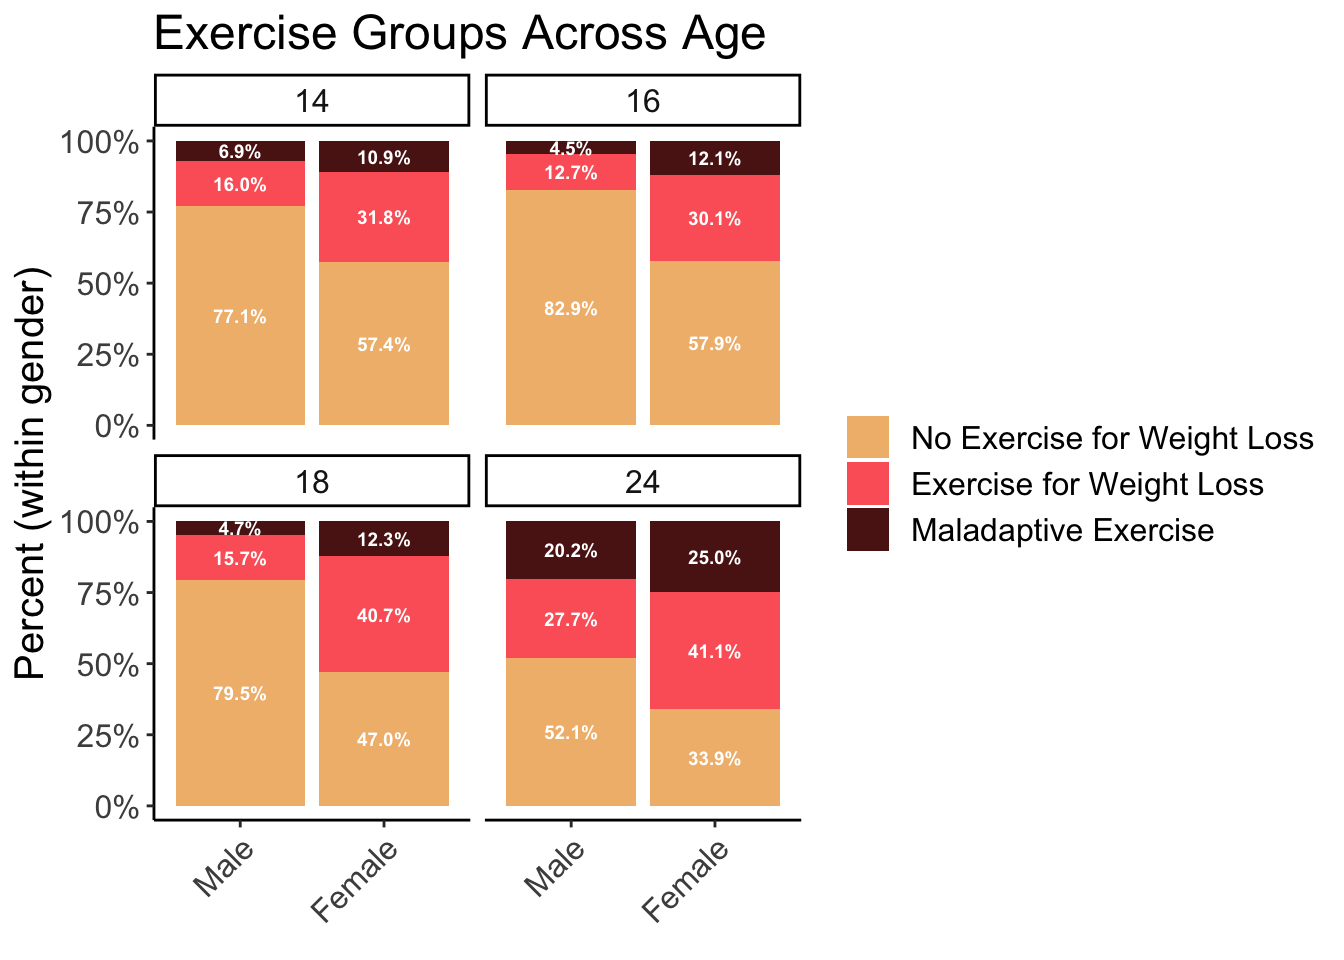
Figure 4.1: Frequency of Exercise Groups Across Age
Visual inspection and raw percentage comparison indicates that percentage of males and female in the three exercise groups is relatively stable from ages 14-16 years, with a possible increase in exercise for weight loss at age 18 among girls, an increase in exercise for weight loss among men at age 24, and an increase in maladaptive exercise across gender at age 24.
4.2 Transitions in Exercise Groups Over Time
A subset of girls (N = 1169) and boys (N = 568) who completed all assessments, ages 14-24. To aid with visualizing transition intensities across exercise groups and age, Figure 4.2 and Figure 4.3 show the frequency of individuals amongst those those completing all assessments who transitioned from each of the three exercise groups to the other groups at each age.
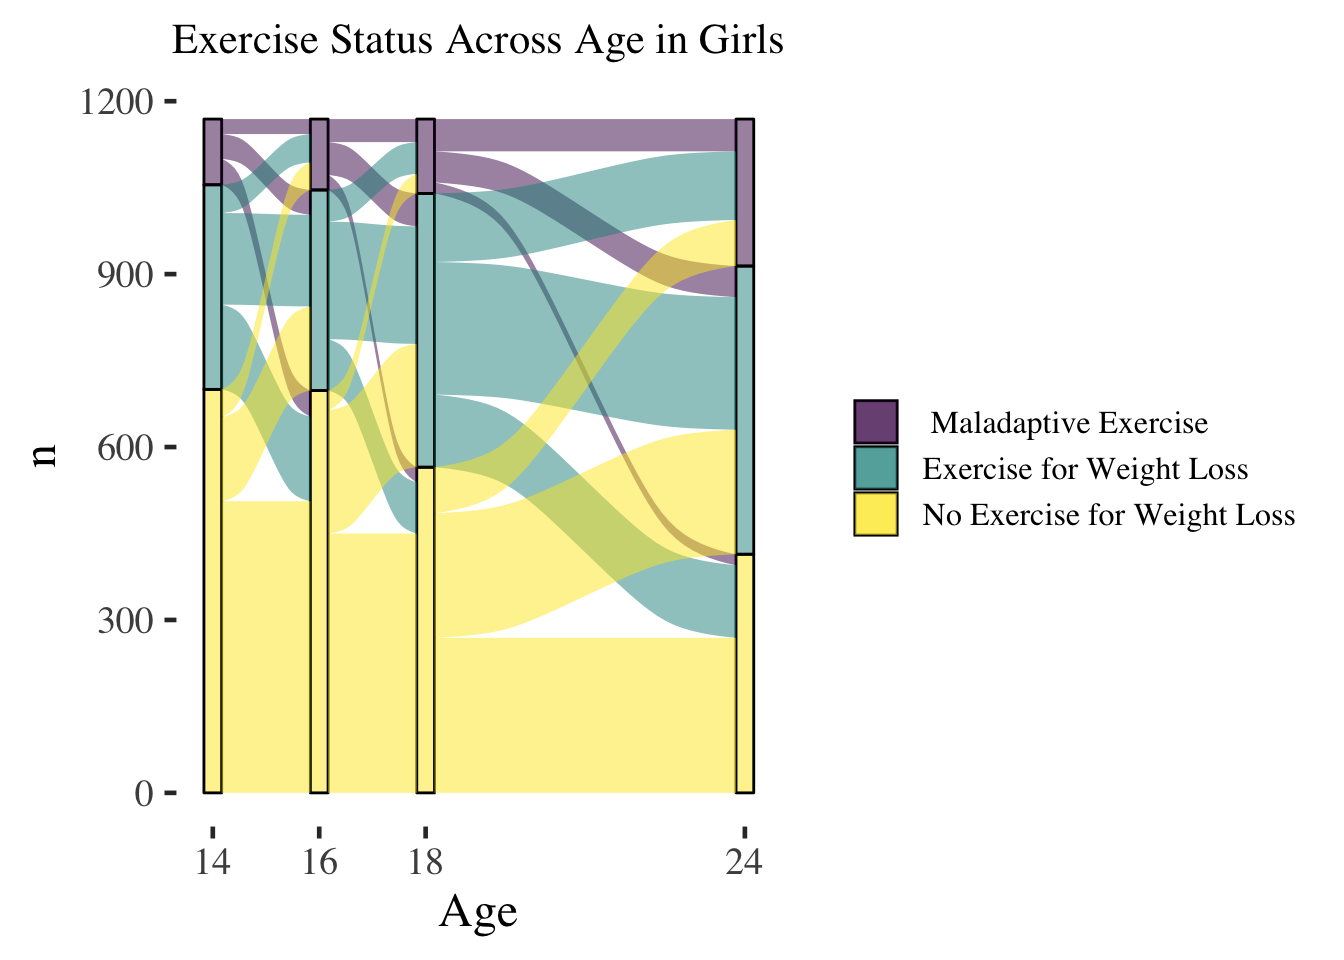
Figure 4.2: Transitions Across Exercise Groups in Girls
Amongst girls, transitions are common across all groups (no Exercise for Weight Loss, Exercise for Weight Loss, Maladaptive Exercise). Among those in the Maladaptive Exercise group, at each age, transition to Exercise for Weight Loss appears common, as does remaining in the Maladaptive Exercise group, with transition to the no-Exercise for Weight Loss group being a more rare transition. Overall, stability in a group remains common, as does transition to-and-from groups that are a single step (e.g. transition from no-Exercise for Weight Loss to Exercise for Weight Loss).
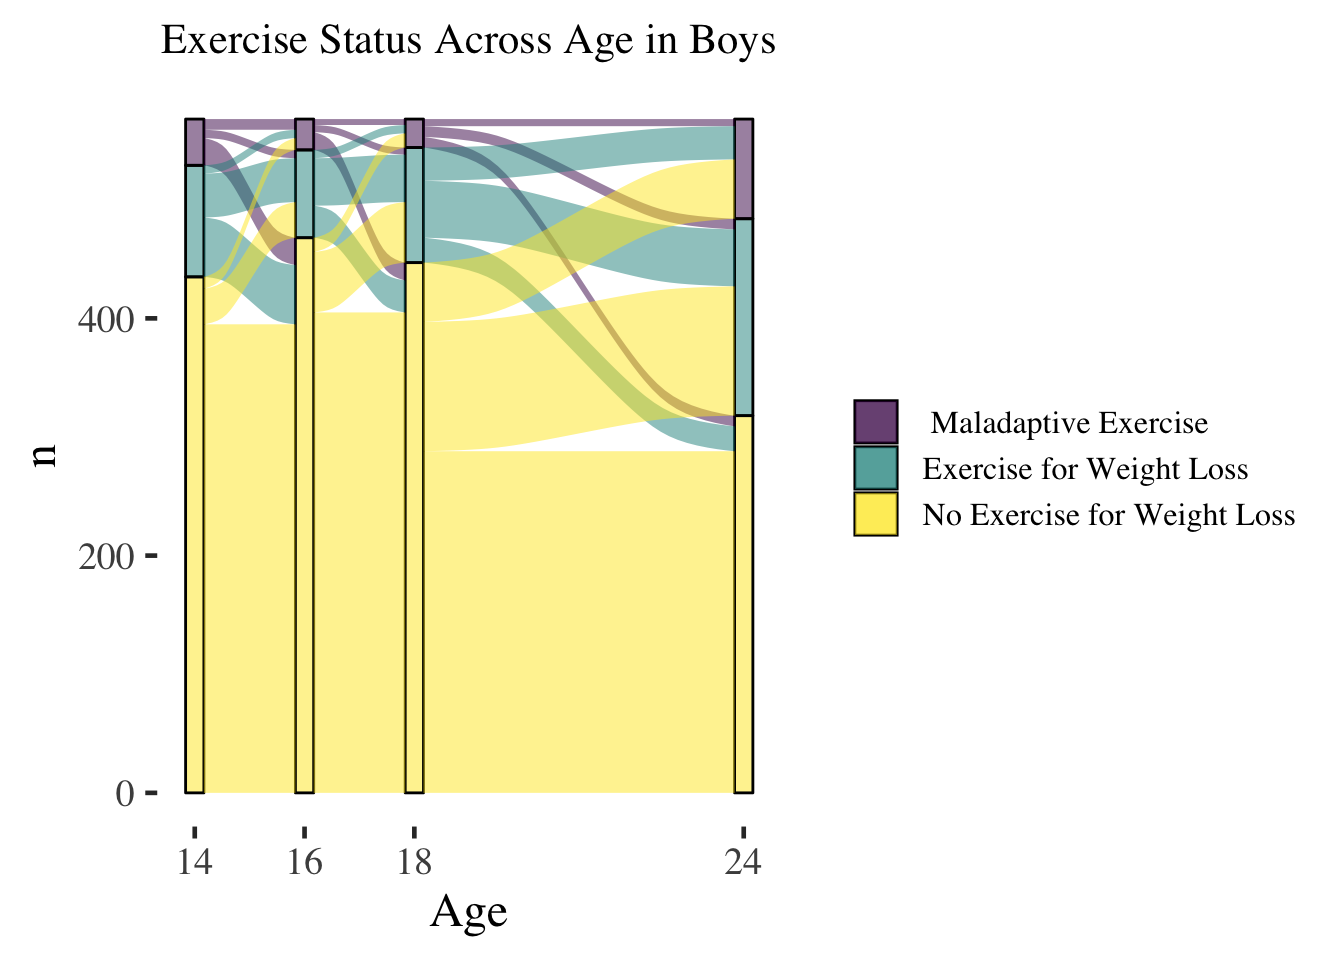
Figure 4.3: Transitions Across Exercise Groups in Boys
Amongst boys, transitions across groups also appears common, with somewhat less stability in the Maladaptive Exercise group, as compared to girls. While there is an increase in Maladaptive Exercise at age 24, as discussed in descriptive analyses, relatively few of these men also reported Maladaptive Exercise at age 18, and a moderate portion of these men reported no-Exercise for Weight Loss at age 18.
4.2.1 Girls
When examining overall transitions amongst girls, visual impressions from the transition plot is confirmed, with the transition from Maladaptive Exercise to the no-Exercise for Weight Loss group being relatively rare (n = 182). Stability in the no-Exercise for Weight Loss and Exercise for Weight Loss groups was common based on raw numbers, as was transition from the no-Exercise for Weight Loss to the Exercise for Weight Loss group (raw numbers presented in Supplemental Table 8.4. The transition probabilities across 1-year based on the Q-matrix allowing direct transitions across all groups with the exception of instantaneous transition from ‘No Exercise for Weight Loss’ to ‘Maladaptive Exercise’ are presented in Table 4.1, with a figure depicting the observed vs. expected prevalence in each group based on this model presented in Supplemental Figure 7.5. As expected, the highest probability outcome for each group over the course of a 1-year period was staying in that group, followed by transition to a neighboring group, with transitions between ‘No Exercise for Weight Loss’ and ‘Maladaptive Exercise’ groups being the least likely transitions. The model with the additional constraint on instantaeneous transitions from ‘Maladaptive Exercise’ to ‘No Exercise for Weight Loss’ (used for covariate analyses due to convergence issues), along with covariates included in the model, is presented in Supplementary Table (8.5).
| No EWL | EWL | Maladaptive Ex | |
|---|---|---|---|
| No EWL | 0.788 ( 0.776, 0.800 ) | 0.188 ( 0.177, 0.200 ) | 0.024 ( 0.021, 0.027 ) |
| EWL | 0.157 ( 0.140, 0.174 ) | 0.675 ( 0.656, 0.696 ) | 0.168 ( 0.151, 0.184 ) |
| Maladaptive Ex | 0.106 ( 0.086, 0.135 ) | 0.291 ( 0.242, 0.336 ) | 0.603 ( 0.558, 0.649 ) |
Note. EWL = ‘Exercise for Weight Loss’. Maladaptive Ex = ‘Maladaptive Exercise’
Covariates were next introduced into the model, to determine whether eating disorder cognitions, BMI, and parent SES predicted transitions between exercise groups during late adolescence. To account for multiple comparisons, a 99.5% confidence interval is presented. Overall, higher BMI Z-score at age 13 appears to relate to increased likelihood of transition from ‘No Exercise for Weight Loss’ to ‘Exercise for Weight Loss’ over the course of a year, with a one standard deviation increase in BMI being associated with a 43% increase in likelihood of transition in a given year. Fear of weight gain, though not meeting the corrected significance threshold, also indicated potential association with increased likelhood of transition from ‘No Exercise for Weight Loss’ to ‘Exercise for Weight Loss’ over the course of a year.
| Covariate | No EWL to EWL | EWL to No EWL | EWL to Maladaptive Ex | Maladaptive Ex to EWL |
|---|---|---|---|---|
| Thin-Ideal Internalization [14] | 1.031 ( 0.854, 1.207 ) | 0.933 ( 0.720, 1.146 ) | 0.917 ( 0.536, 1.297 ) | 0.906 ( 0.476, 1.335 ) |
| Body Satisfaction [14] | 1.190 ( 0.869, 1.512 ) | 1.314 ( 0.825, 1.804 ) | 1.085 ( 0.568, 1.602 ) | 1.117 ( 0.491, 1.742 ) |
| Fear of Weight Gain [14] | 1.477 ( 0.999, 1.954 ) | 1.233 ( 0.758, 1.709 ) | 1.307 ( 0.352, 2.262 ) | 1.101 ( 0.213, 1.988 ) |
| BMI Z-score [13] | 1.434 ( 1.195, 1.673 ) | 1.086 ( 0.834, 1.339 ) | 1.083 ( 0.620, 1.546 ) | 1.105 ( 0.554, 1.655 ) |
| Parent Occupation | 0.998 ( 0.838, 1.158 ) | 0.873 ( 0.695, 1.051 ) | 1.031 ( 0.674, 1.389 ) | 1.126 ( 0.679, 1.573 ) |
Note. EWL = ‘Exercise for Weight Loss’. Maladaptive Ex = ‘Maladaptive Exercise’
4.2.2 Boys
Raw transitions amongst boys are presented in Supplemental Table 8.6. Overall, there appeared to be less stability in the Maladaptive Exercise group, as compared to girls, by examination of raw numbers.The transition probabilities across 1-year based on the Q-matrix allowing direct transitions across all groups with the exception of instantaneous transition from ‘No Exercise for Weight Loss’ to ‘Maladaptive Exercise’ are presented in Table 4.3, with a figure depicting the observed vs. expected prevalence in each group based on this model presented in Supplemental Figure 7.6. Stability in the ‘No Exercise for Weight Loss’ group was common, and stability in all groups was the most common 1-year outcome. There was a moderate probability (~16-20%) of boys in the ‘Exercise for Weight Loss’ group transitioning to either the ‘No Exercise for Weight Loss’ or ‘Maladaptive Exercise’ groups over a 1-year period. Similarly, boys in the ‘Maladaptive Exercise’ group showed a moderate probability of transitioning to either the Exercise for Weight Loss (18%) or ‘No Exercise for Weight Loss’ (19%) group over a 1-year period. Models including covariates did not converge for boys, due to low base rates of some transitions.
| No EWL | EWL | Maladaptive Ex | |
|---|---|---|---|
| No EWL | 0.897 ( 0.888, 0.907 ) | 0.091 ( 0.082, 0.100 ) | 0.012 ( 0.009, 0.014 ) |
| EWL | 0.203 ( 0.174, 0.239 ) | 0.629 ( 0.584, 0.667 ) | 0.168 ( 0.139, 0.198 ) |
| Maladaptive Ex | 0.193 ( 0.150, 0.248 ) | 0.178 ( 0.120, 0.261 ) | 0.629 ( 0.544, 0.700 ) |
Note. EWL = ‘Exercise for Weight Loss’. Maladaptive Ex = ‘Maladaptive Exercise’
While Markov state models are useful in describing overall transition patterns, one notable limitation is the assumption under these models that transitions are time independent; that is, that that transition to and from states is not dependent on age. This removes consideration of developmental timepoints that may be relevant as risk progresses. Further, the inclusion of covariates is able to test the effect of these covariates on specific transitions, but not overall risk of exercise for weight loss or driven exercise over time. In the next step of analysis, mixed models examine
4.3 Imputation
As stated in the analytic plan, data was imputed prior to conducting mixed effects models, with 10 iterations on 20 imputed datasets The predictor matrix is presented in Supplemental Table 8.8 ; the percent missing for each variable prior to imputation is presented in Supplemental Table 8.9 for girls and Supplemental Table 8.10 for boys, along with the influx (overall number of variable pairs \((Y_j,Y_k)\) with \(Y_j\) missing and \(Y_k\) observed, divided by the total number of observed data cells), and outflux (the number of variable pairs with \(Y_j\) observed and \(Y_k\) missing, divided by the total number of incomplete data cells) for each variable. The influx refers to connection to the observed data (ease of imputation, with one representing the highest level of connection to the observed data) the outflux refers to potential contribution to this variable in imputing other data, both on a 0-1 scale with one representing the highest possible levels of influx/outflux. Overall, there was moderate levels of missingness in the current data.
4.4 Mixed Effects Models - Maladaptive Exercise over Time
Mixed effects logistic regression models examined changes in maladaptive exercise across age, along with predictors baseline (age 14) predictors of this behavior and interactions between baseline predictors and the linear effect of age.
4.4.1 Girls
Results for girls are reported in 4.4. Model comparisons (presented in Table 4.5 ), indicated that the most complex (Step 3) model which included all predictors and Age x Predictor interactions fit best. In the baseline model, a substantial portion of girls (~13%) reported maladaptive exercise. Baseline levels of maladaptive exercise at age 14 were included as a random effect in subsequent models. In the model including only age as a predictor, age was a significant predictor, with effect sizes indicating a small but relevant linear increase in maladaptive exercise risk each year. In the model including parent SES and BMI at age 13 as predictors, BMI Z-score at age 13 predicted higher levels of maladaptive exercise overall amongst girls, with a one standard deviation in BMI increasing odds (\(OR = 1.35\)) of maladaptive exercise. When ED cognitions were introduced into the model (Step 2 Covariates), BMI Z-score remained a significant predictor of maladaptive exercise, though its effect size decreased in magnitude. Fear of weight gain at age 14 also emerged as a significant predictor. In the final model that included Age x Predictor interactions (Step 3 Covariates), Age, Age 13 BMI-Z, and Fear of Weight Gain remained significant predictors, and thin-ideal internalization at age 14 also reached significance. In this model, increase of 1-unit in fear of weight gain (e.g. increasing from ‘Not at All’ afraid of weight gain, the median response, to ‘A Little’ afraid of weight gain) was associated with odds of maladaptive exercise over adolescent and young adulthood increasing by 80%, while a one standard deviation increase in thin-ideal internalization mean was associated with a modest (14%) increase in odds of maladaptive exercise.
| Model | term | estimate | std.error | 0.25 % | 99.75 % |
|---|---|---|---|---|---|
| Baseline Model | (Intercept) | 0.133 | 0.042 | 0.017 | 0.250 |
| Age Effect Model | (Intercept) | 0.094 | 0.052 | -0.051 | 0.240 |
| Age Effect Model | Age | 1.079 | 0.007 | 1.060 | 1.098 |
| Step 1 Covariates | (Intercept) | 0.082 | 0.132 | -0.289 | 0.453 |
| Step 1 Covariates | Age | 1.080 | 0.007 | 1.060 | 1.099 |
| Step 1 Covariates | Parent SES | 1.015 | 0.034 | 0.919 | 1.112 |
| Step 1 Covariates | BMI Z - Age 13 | 1.348 | 0.033 | 1.257 | 1.439 |
| Step 2 Covariates | (Intercept) | 0.063 | 0.134 | -0.314 | 0.441 |
| Step 2 Covariates | Age | 1.080 | 0.007 | 1.061 | 1.099 |
| Step 2 Covariates | Parent SES | 1.015 | 0.034 | 0.920 | 1.110 |
| Step 2 Covariates | BMI Z - Age 13 | 1.181 | 0.034 | 1.086 | 1.276 |
| Step 2 Covariates | Fear of Wt Gain - Age 14 | 1.624 | 0.042 | 1.507 | 1.742 |
| Step 2 Covariates | Body Dissatisifaction - Age 14 | 1.062 | 0.034 | 0.966 | 1.159 |
| Step 2 Covariates | Thin-ideal Internalization - Age 14 | 1.092 | 0.035 | 0.993 | 1.191 |
| Step 3 Age x Cov Interactions | (Intercept) | 0.057 | 0.138 | -0.332 | 0.446 |
| Step 3 Age x Cov Interactions | Age | 1.103 | 0.009 | 1.077 | 1.129 |
| Step 3 Age x Cov Interactions | Parent SES | 1.015 | 0.034 | 0.920 | 1.111 |
| Step 3 Age x Cov Interactions | BMI Z - Age 13 | 1.181 | 0.045 | 1.054 | 1.309 |
| Step 3 Age x Cov Interactions | Fear of Wt Gain - Age 14 | 1.801 | 0.055 | 1.645 | 1.956 |
| Step 3 Age x Cov Interactions | Body Dissatisifaction - Age 14 | 1.124 | 0.048 | 0.989 | 1.260 |
| Step 3 Age x Cov Interactions | Thin-ideal Internalization - Age 14 | 1.147 | 0.049 | 1.009 | 1.285 |
| Step 3 Age x Cov Interactions | Age x BMI (13) | 1.000 | 0.007 | 0.981 | 1.019 |
| Step 3 Age x Cov Interactions | Age x Fear of Wt Gain (14) | 0.977 | 0.008 | 0.954 | 1.000 |
| Step 3 Age x Cov Interactions | Age x Body Satisfaction (14) | 0.988 | 0.007 | 0.968 | 1.008 |
| Step 3 Age x Cov Interactions | Age x Thin-Ideal Internalization (14) | 0.990 | 0.007 | 0.971 | 1.008 |
| statistic | df1 | df2 | p.value | riv | |
|---|---|---|---|---|---|
| Baseline vs. Age Effects | 126.451 | 1 | 181.458 | 0.000 | 0.364 |
| Age vs. Step 1 Covs | 40.781 | 2 | 164.598 | 0.000 | 0.799 |
| Step 1 Covs vs. Step 2 Covs | 54.459 | 3 | 285.864 | 0.000 | 0.727 |
| Step 2 Covs vs. Step 3 Age x Cov Interactions | 4.715 | 4 | 1068.449 | 0.001 | 0.328 |
4.4.2 Boys
Models for boys are presented in Table 4.6, with model comparisons presented in Table 4.7. For boys, the introduction of age, baseline covariates, and baseline ED predictors resulted in improved model fit, though there was not an improved model fit via age x predictor interactions. Boys showed low initial variability in maladaptive exercise endorsement, however, there was a significant effect of age, such that maladaptive exercise endoresment was more common as boys got older (odds increasing at ~10% per year). When including parent SES and Age 13 BMI in the model, age 13 BMI was again a significant predictor of maladaptive exercise engagement, with odds of maladaptive exercise increasing 89% with a one standard deviation increase in BMI. When baseline ED cognitions were entered into the model, fear of weight gain was the only additional significant predictor of maladaptive exercise, with similar increase in odds as compared to girls, as fear of weight gain increased.
| Model | term | estimate | std.error | 0.25 % | 99.75 % |
|---|---|---|---|---|---|
| Baseline Model | (Intercept) | 0.050 | 0.085 | -0.189 | 0.289 |
| Age Effect Model | (Intercept) | 0.032 | 0.108 | -0.271 | 0.335 |
| Age Effect Model | Age | 1.096 | 0.010 | 1.067 | 1.126 |
| Step 1 Covariates | (Intercept) | 0.030 | 0.240 | -0.646 | 0.706 |
| Step 1 Covariates | Age | 1.097 | 0.011 | 1.068 | 1.127 |
| Step 1 Covariates | Parent SES | 0.984 | 0.061 | 0.812 | 1.155 |
| Step 1 Covariates | BMI Z - Age 13 | 1.867 | 0.054 | 1.717 | 2.018 |
| Step 2 Covariates | (Intercept) | 0.027 | 0.238 | -0.641 | 0.694 |
| Step 2 Covariates | Age | 1.098 | 0.010 | 1.069 | 1.127 |
| Step 2 Covariates | Parent SES | 0.997 | 0.061 | 0.827 | 1.167 |
| Step 2 Covariates | BMI Z - Age 13 | 1.739 | 0.056 | 1.581 | 1.896 |
| Step 2 Covariates | Fear of Wt Gain - Age 14 | 1.886 | 0.086 | 1.643 | 2.129 |
| Step 2 Covariates | Body Dissatisifaction - Age 14 | 1.008 | 0.056 | 0.850 | 1.166 |
| Step 2 Covariates | Thin-ideal Internalization - Age 14 | 1.192 | 0.064 | 1.013 | 1.371 |
| Step 3 Age x Cov Interactions | (Intercept) | 0.024 | 0.245 | -0.665 | 0.713 |
| Step 3 Age x Cov Interactions | Age | 1.118 | 0.014 | 1.080 | 1.157 |
| Step 3 Age x Cov Interactions | Parent SES | 0.997 | 0.062 | 0.824 | 1.170 |
| Step 3 Age x Cov Interactions | BMI Z - Age 13 | 1.748 | 0.075 | 1.537 | 1.958 |
| Step 3 Age x Cov Interactions | Fear of Wt Gain - Age 14 | 2.326 | 0.099 | 2.047 | 2.605 |
| Step 3 Age x Cov Interactions | Body Dissatisifaction - Age 14 | 1.005 | 0.075 | 0.793 | 1.217 |
| Step 3 Age x Cov Interactions | Thin-ideal Internalization - Age 14 | 1.204 | 0.083 | 0.970 | 1.438 |
| Step 3 Age x Cov Interactions | Age x BMI (13) | 0.999 | 0.009 | 0.973 | 1.025 |
| Step 3 Age x Cov Interactions | Age x Fear of Wt Gain (14) | 0.954 | 0.017 | 0.906 | 1.002 |
| Step 3 Age x Cov Interactions | Age x Body Satisfaction (14) | 1.000 | 0.012 | 0.966 | 1.034 |
| Step 3 Age x Cov Interactions | Age x Thin-Ideal Internalization (14) | 0.998 | 0.012 | 0.963 | 1.032 |
| statistic | df1 | df2 | p.value | riv | |
|---|---|---|---|---|---|
| Baseline vs. Age Effects | 78.096 | 1 | 138.376 | 0.000 | 0.445 |
| Age vs. Step 1 Covs | 61.979 | 2 | 103.188 | 0.000 | 1.322 |
| Step 1 Covs vs. Step 2 Covs | 21.106 | 3 | 179.303 | 0.000 | 1.158 |
| Step 2 Covs vs. Step 3 Age x Cov Interactions | 2.053 | 4 | 466.362 | 0.086 | 0.616 |
4.5 Mixed-Effect Models - Exercise for Weight Loss
The same multilevel modeling approach was used to examine endorsement of EWL over time in the sample, substituting a cummulative-link modeling approach to accommodate the ordinal outcome of EWL frequency.To compare models with imputed datasets with ordinal outcomes implemented in R, we estimated the improvement in fit of models by examining the mean AIC of all 20 models for imputed data, along with the mean difference in log liklihood when comparing all nested models on all iterations of imputed datasets. Summary statistics for model comparisons are presented in Table 4.8 for Girls and Table 4.10 for boys
4.5.1 Girls
Overall, the most complex model (including Age x Predictor interactions) was identified as the best model fit for girls, both in terms of the median -2 log likelihood difference comparison as well as via the lowest AIC.
| Model | AIC | Model Comparison | Median -2LL difference | df | p-value |
|---|---|---|---|---|---|
| Age Model | 34809.62 | NA | NA | ||
| Step 1 Covs | 34227.38 | Age vs. Step 1 Covs | 573.20 | 2 | 0 |
| Step 2 Covs | 33773.57 | Step 1 Covs vs. Step 2 Covs | 463.60 | 3 | 0 |
| Step 3 Covs | 33696.10 | Step 2 Covs vs. Step 3 Age x Cov interactions | 85.12 | 4 | 0 |
With regards to specific predictors, age, parent SES, BMI at age 13, thin-ideal internalization, and fear of weight gain all emerged as significant, positive predictors of exercise for weight loss frequency (see Table 4.9 for coefficients). Body dissatisfaction was the only ED cognition variable that did not significantly predict exercise for weight loss amongst girls. Once Age x Covariate interactions were entered into the model, body dissatisfaction did emerge as a significant predictor, along with an interaction between body dissatisfaction and age, as well as an interaction between fear of weight gain and age. In this instance, while higher levels of body dissatisfaction at age 14 were, overall, associated with increased frequency of exercise for weight loss, this association attenuated across age. Similarly, the fear of weight gain by age interaction suggests a similar pattern, with overall, a strong association between increased fear of weight gain at age 14 and exercise for weight loss during adolescence and young adulthood, the relationship between 14-year-old fear of weight gain and exercise for weight loss frequency is not as pronounced at later ages.
| Model | term | OR | OR LCI | OR HCI |
|---|---|---|---|---|
| Age Effect Model | 0|1 | 1.461 | 1.330 | 1.605 |
| Age Effect Model | 1|2 | 7.433 | 6.536 | 8.453 |
| Age Effect Model | Age | 1.113 | 1.097 | 1.129 |
| Step 1 Covariates | 0|1 | 2.107 | 1.579 | 2.813 |
| Step 1 Covariates | 1|2 | 10.712 | 7.954 | 14.427 |
| Step 1 Covariates | Age | 1.113 | 1.097 | 1.129 |
| Step 1 Covariates | Parent SES | 1.073 | 0.994 | 1.159 |
| Step 1 Covariates | BMI Z - Age 13 | 1.565 | 1.463 | 1.673 |
| Step 2 Covariates | 0|1 | 2.727 | 2.063 | 3.607 |
| Step 2 Covariates | 1|2 | 13.884 | 10.392 | 18.550 |
| Step 2 Covariates | Age | 1.113 | 1.097 | 1.129 |
| Step 2 Covariates | Parent SES | 1.069 | 0.995 | 1.149 |
| Step 2 Covariates | BMI Z - Age 13 | 1.377 | 1.280 | 1.481 |
| Step 2 Covariates | Fear of Wt Gain - Age 14 | 1.640 | 1.485 | 1.811 |
| Step 2 Covariates | Body Dissatisifaction - Age 14 | 1.066 | 0.995 | 1.143 |
| Step 2 Covariates | Thin-ideal Internalization - Age 14 | 1.094 | 1.022 | 1.172 |
| Step 3 Age x Cov Interactions | 0|1 | 3.029 | 2.241 | 4.094 |
| Step 3 Age x Cov Interactions | 1|2 | 15.537 | 11.351 | 21.267 |
| Step 3 Age x Cov Interactions | Age | 1.139 | 1.115 | 1.163 |
| Step 3 Age x Cov Interactions | Parent SES | 1.070 | 0.995 | 1.151 |
| Step 3 Age x Cov Interactions | BMI Z - Age 13 | 1.456 | 1.334 | 1.589 |
| Step 3 Age x Cov Interactions | Fear of Wt Gain - Age 14 | 1.820 | 1.615 | 2.052 |
| Step 3 Age x Cov Interactions | Body Dissatisifaction - Age 14 | 1.143 | 1.043 | 1.251 |
| Step 3 Age x Cov Interactions | Thin-ideal Internalization - Age 14 | 1.109 | 1.013 | 1.215 |
| Step 3 Age x Cov Interactions | Age x BMI (13) | 0.987 | 0.974 | 1.000 |
| Step 3 Age x Cov Interactions | Age x Fear of Wt Gain (14) | 0.974 | 0.954 | 0.995 |
| Step 3 Age x Cov Interactions | Age x Body Satisfaction (14) | 0.984 | 0.970 | 0.997 |
| Step 3 Age x Cov Interactions | Age x Thin-Ideal Internalization (14) | 0.997 | 0.984 | 1.010 |
4.5.2 Boys
For boys, again, the Step 3 model including all covariates and Age x Covariate interactions appeared to provide the most optimal model fit.
| Model | AIC | Model Comparison | Median -2LL difference | df | p-value |
|---|---|---|---|---|---|
| Age Model | 19021.00 | NA | NA | ||
| Step 1 Covs | 18300.84 | Age vs. Step 1 Covs | 720.50 | 2 | 0e+00 |
| Step 2 Covs | 18162.73 | Step 1 Covs vs. Step 2 Covs | 145.80 | 3 | 0e+00 |
| Step 3 Covs | 18133.78 | Step 2 Covs vs. Step 3 Age x Cov interactions | 38.01 | 4 | 1e-07 |
Specific Parameters and coefficients are presented in Table 4.11. Amongst boys, associations between ED cognitions and exercise for weight loss were more limited. age, BMI at age 13, and fear of weight gain all appeared to be robust predictors of exercise for weight loss. Odds of exercise for weight loss increased modestly for each year of age, with pronounced increases in exercise for weight loss as BMI z-score at age 13 and fear of weight gain at age 14 increased. As with girls, there was a significant interaction between age and fear of weight gain at age 14 in prediction of exercise for weight loss, with fear of weight gain showing greater predictive power at younger (more proximal) ages.
| Model | term | OR | OR LCI | OR HCI |
|---|---|---|---|---|
| Age Effect Model | 0|1 | 5.663 | 4.892 | 6.555 |
| Age Effect Model | 1|2 | 19.940 | 16.577 | 23.985 |
| Age Effect Model | Age | 1.105 | 1.084 | 1.126 |
| Step 1 Covariates | 0|1 | 7.449 | 5.055 | 10.975 |
| Step 1 Covariates | 1|2 | 26.312 | 17.424 | 39.734 |
| Step 1 Covariates | Age | 1.105 | 1.084 | 1.127 |
| Step 1 Covariates | Parent SES | 1.035 | 0.933 | 1.148 |
| Step 1 Covariates | BMI Z - Age 13 | 1.896 | 1.730 | 2.077 |
| Step 2 Covariates | 0|1 | 8.399 | 5.772 | 12.223 |
| Step 2 Covariates | 1|2 | 29.741 | 19.907 | 44.431 |
| Step 2 Covariates | Age | 1.105 | 1.084 | 1.127 |
| Step 2 Covariates | Parent SES | 1.044 | 0.944 | 1.155 |
| Step 2 Covariates | BMI Z - Age 13 | 1.791 | 1.625 | 1.974 |
| Step 2 Covariates | Fear of Wt Gain - Age 14 | 1.730 | 1.431 | 2.090 |
| Step 2 Covariates | Body Satisifaction - Age 14 | 1.009 | 0.911 | 1.119 |
| Step 2 Covariates | Thin-ideal Internalization - Age 14 | 1.057 | 0.958 | 1.167 |
| Step 3 Age x Cov Interactions | 0|1 | 9.226 | 6.233 | 13.657 |
| Step 3 Age x Cov Interactions | 1|2 | 32.763 | 21.615 | 49.663 |
| Step 3 Age x Cov Interactions | Age | 1.126 | 1.102 | 1.151 |
| Step 3 Age x Cov Interactions | Parent SES | 1.044 | 0.944 | 1.156 |
| Step 3 Age x Cov Interactions | BMI Z - Age 13 | 1.877 | 1.663 | 2.119 |
| Step 3 Age x Cov Interactions | Fear of Wt Gain - Age 14 | 2.087 | 1.692 | 2.573 |
| Step 3 Age x Cov Interactions | Body Satisifaction - Age 14 | 1.057 | 0.919 | 1.215 |
| Step 3 Age x Cov Interactions | Thin-ideal Internalization - Age 14 | 1.057 | 0.939 | 1.191 |
| Step 3 Age x Cov Interactions | Age x BMI (13) | 0.990 | 0.973 | 1.008 |
| Step 3 Age x Cov Interactions | Age x Fear of Wt Gain (14) | 0.955 | 0.920 | 0.993 |
| Step 3 Age x Cov Interactions | Age x Body Satisfaction (14) | 0.990 | 0.970 | 1.010 |
| Step 3 Age x Cov Interactions | Age x Thin-Ideal Internalization (14) | 1.000 | 0.979 | 1.022 |